Bestand:1973 Atlantic hurricane season summary map.png

Grootte van deze voorvertoning: 800 × 494 pixels. Andere resoluties: 320 × 198 pixels | 640 × 396 pixels | 1.024 × 633 pixels | 1.280 × 791 pixels | 3.000 × 1.854 pixels.
Afbeelding in hogere resolutie (3.000 × 1.854 pixels, bestandsgrootte: 3,99 MB, MIME-type: image/png)
| Dit is een bestand van Wikimedia Commons, een verzameling van vrije inhoud die door de Wikimedia Foundation wordt gehost. Onderstaande beschrijving komt van de beschrijving van het bestand daar. |
| Beschrijving |
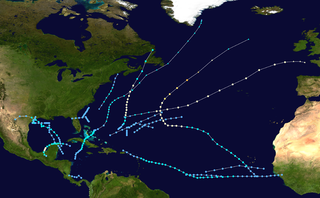
English: This map shows the tracks of all tropical cyclones in the 1973 Atlantic hurricane season. The points show the location of each storm at 6-hour intervals. The colour represents the storm's maximum sustained wind speeds as classified in the Saffir-Simpson Hurricane Scale (see below), and the shape of the data points represent the type of the storm.
Tropical depression (≤38 mph, ≤62 km/h)
Tropical storm (39–73 mph, 63–118 km/h)
Category 1 (74–95 mph, 119–153 km/h)
Category 2 (96–110 mph, 154–177 km/h)
Category 3 (111–129 mph, 178–208 km/h)
Category 4 (130–156 mph, 209–251 km/h)
Category 5 (≥157 mph, ≥252 km/h)
Unknown
Storm type |
| Bron | Created using Wikipedia:WikiProject Tropical cyclones/Tracks. The background image is from NASA [1]. The tracking data is from the National Hurricane Center's Atlantic hurricane database |
| Auteur | Cyclonebiskit |
| Dit werk vrijgegeven in het publieke domein door de auteur, Cyclonebiskit. Dit is wereldwijd van toepassing. In sommige landen is dit wettelijk niet mogelijk; in die gevallen geldt: Cyclonebiskit staat iedereen toe dit werk voor eender welk doel te gebruiken, zonder enige voorwaarden, tenzij zulke voorwaarden door de wet worden voorgeschreven. |
Bestandsgeschiedenis
Klik op een datum/tijd om het bestand te zien zoals het destijds was.
| Datum/tijd | Miniatuur | Afmetingen | Gebruiker | Opmerking | |
|---|---|---|---|---|---|
| huidige versie | 9 jun 2013 20:26 | | 3.000 × 1.854 (3,99 MB) | Supportstorm | Higher resolution |
| 28 sep 2009 19:03 |  | 1.024 × 633 (564 kB) | Cyclonebiskit | {{Information |Description={{en|Track map of the 1973 Atlantic hurricane season. The points show the location of the storm at 6-hour intervals. The colour represents the storm's [[:w:maximum sustained wind|maximum sust |
Bestandsgebruik
Geen enkele pagina gebruikt dit bestand.
Globaal bestandsgebruik
De volgende andere wiki's gebruiken dit bestand:
- Gebruikt op en.wikipedia.org
- 1973 Atlantic hurricane season
- Template:1973 Atlantic hurricane season buttons
- Tropical Storm Gilda (1973)
- Wikipedia:Good topics
- Hurricane Brenda (1973)
- Tropical Storm Delia (1973)
- Tropical Storm Christine (1973)
- Wikipedia:Featured and good topic candidates/1973 Atlantic hurricane season/archive1
- Wikipedia:Featured and good topic candidates/Featured log/October 2009
- Wikipedia:Featured and good topic candidates/Good log/October 2009
- Wikipedia:Featured topics/1973 Atlantic hurricane season
- Gebruikt op es.wikipedia.org
- Gebruikt op pt.wikipedia.org
- Gebruikt op ru.wikipedia.org
- Gebruikt op zh.wikipedia.org